Conference talk · 16th EASN International Conference · 27–30 October 2026
Experimental Validation of an Aircraft Digital Twin: From Concept to Validation
✓ Presented: 29 October 2026, 18:20 · room 05-114 · Digital Engineering for Aerospace Systems IV session · by Melih Yıldız
Before building a test, check that it could actually prove your model wrong.
Summary
Digital twins are usually validated by whatever data can be found. A comparison validates nothing, however, if the correction applied to the measurement is larger than the model error it is meant to reveal.
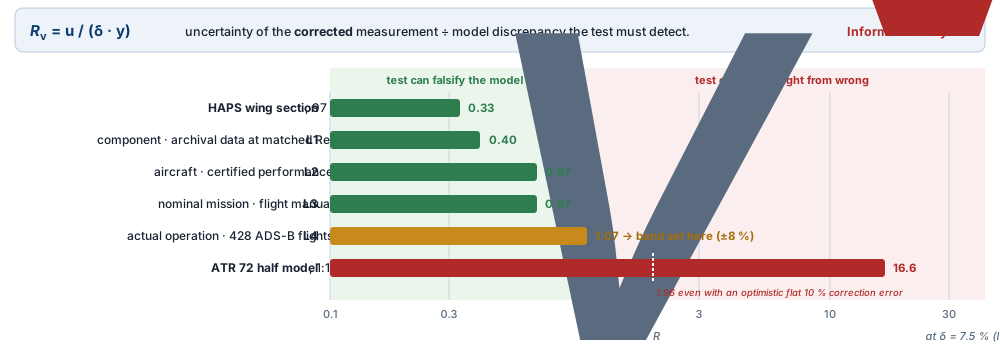
We express this as a validation-resolution ratio, Rv = u / (δ · y): the uncertainty of the corrected measurement divided by the model discrepancy the test must detect. A comparison is informative only if Rv < 1. We apply it to the three evidence sources available for an ATR 72-500 digital twin built in Simcenter Amesim that claims 5–10 % accuracy.
Three findings
- The tunnel campaign was cancelled after a one-afternoon audit. The largest model that fits gives Re = 4.0×10⁴ against 1.4×10⁷ in cruise (×348). The scale correction is 122 % of the drag coefficient itself, giving Rv = 16.6, and still 1.96 under an optimistic flat 10 % correction error.
- Operational data change the question. Across 428 ADS-B profiles the median stage is 371 km, while the design mission is 750 km, a distance only 6 % of flights reach. The unknown mass matters less than expected: ±21.5 % in take-off mass gives only ±3.4 % in block fuel.
- Match the facility to the aircraft class. The same tunnel reproduces a 20 km HAPS wing's Reynolds number (1.9×10⁵) exactly with a 97 mm chord, giving Rv = 0.33.
Three evidence sources, one test
| Source | Key number | Rv |
|---|---|---|
| ATR 72 half model, 1:113, 400×400 mm tunnel | Re gap ×348; correction 122 % of CD | 16.6 |
| ADS-B (OpenSky), 428 complete ATR 72 flights | resolves ≈ 8 %; mass → fuel attenuated ×6.4 | 1.07 |
| HAPS wing section, 97 mm chord, same tunnel | Re matched exactly; M 0.087 vs 0.10 | 0.33 |
Companion talk at this conference: Machine Learning-Assisted Multidisciplinary Design Optimization in Aircraft Conceptual Design Using Digital Twin Technology